Histogram Viewer v3.0.1resigned1
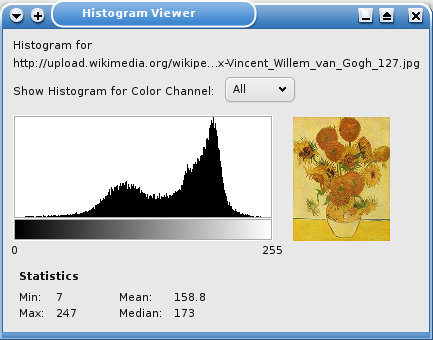
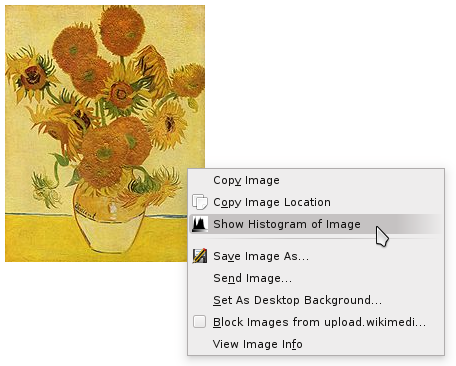

The Histogram Viewer generates the histogram of a selected image. When the user right clicks on an image, the option "Show Histogram of Image" is shown in the context menu. If the user selects this option a new window is opened which shows the histogram of the image.
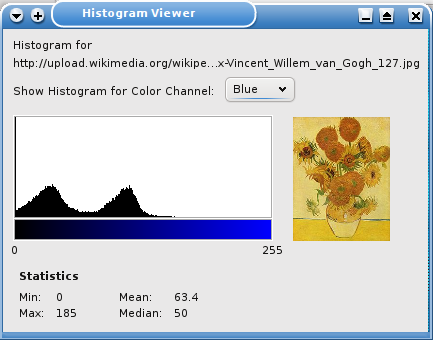
By default the histogram is generated based on the sum of all 3 RGB color channels. Additionally the histogram for each of the 3 color channels can be shown. Some statistics about the histogram are also shown.
Features
* Grayscale histogram
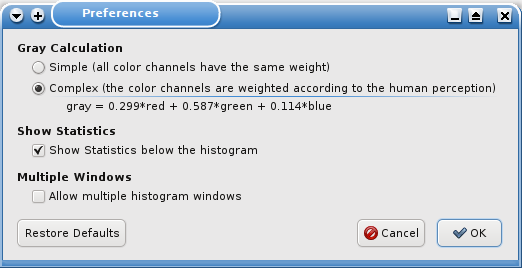
* Option to select the way the grayscale histogram is calculated
* all color channels have the same weight
* the color channels are weighted according to the human perception (gray = 0.299*red + 0.587*green + 0.114*blue)
* shows histograms for each color channel
* shows statistics about the histogram: min, max, mean, median
* optional hiding of the statistics
* shows the individual value and its number of occurrences, when the user moves the mouse over the histogram