Graphly - Keap Reporting v2.6


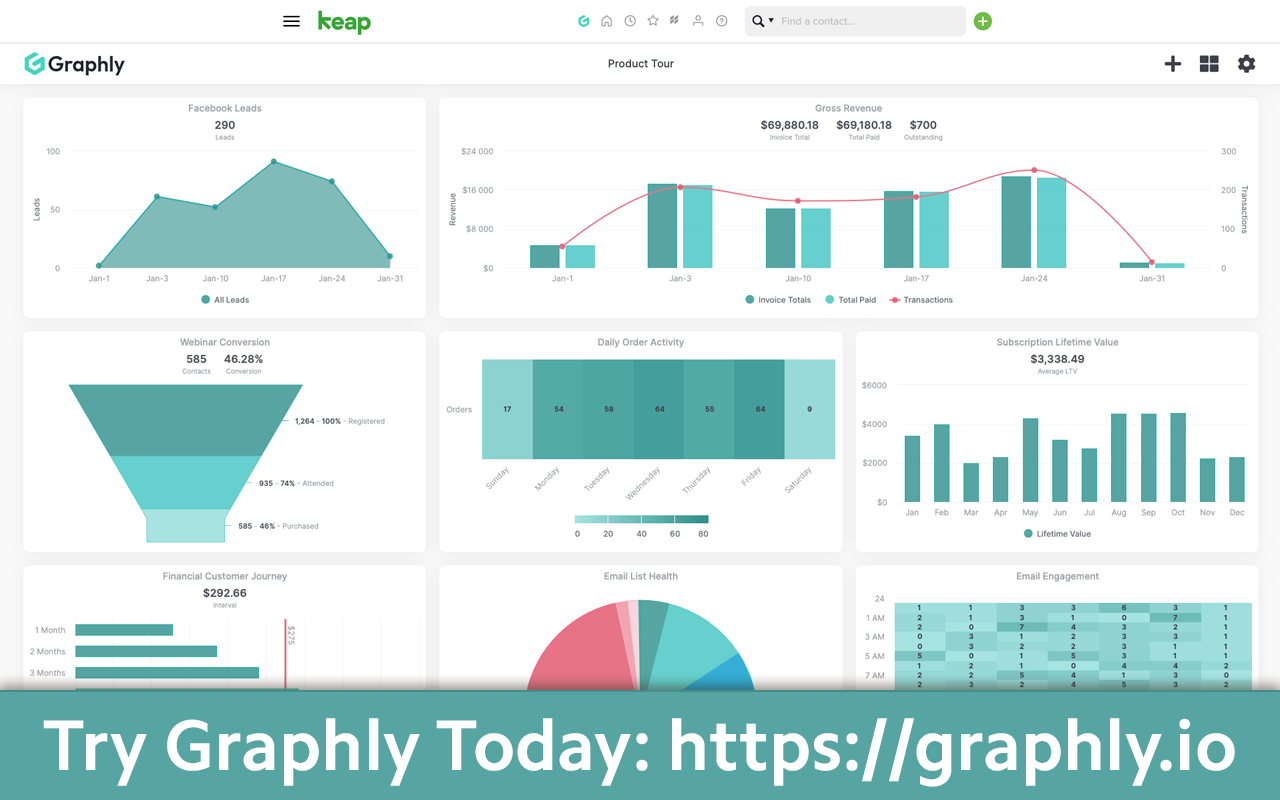
Do you have questions not being answered by Keap's native reports? You're not alone. Keap is a small business automation platform, not a business intelligence platform. And yet, Keap has all the information you'd ever want to know stored deep inside their database. That's why we built Graphly. Graphly helps Keap users pull back the curtains on data hidden in Keap so they can take meaningful action to grow.
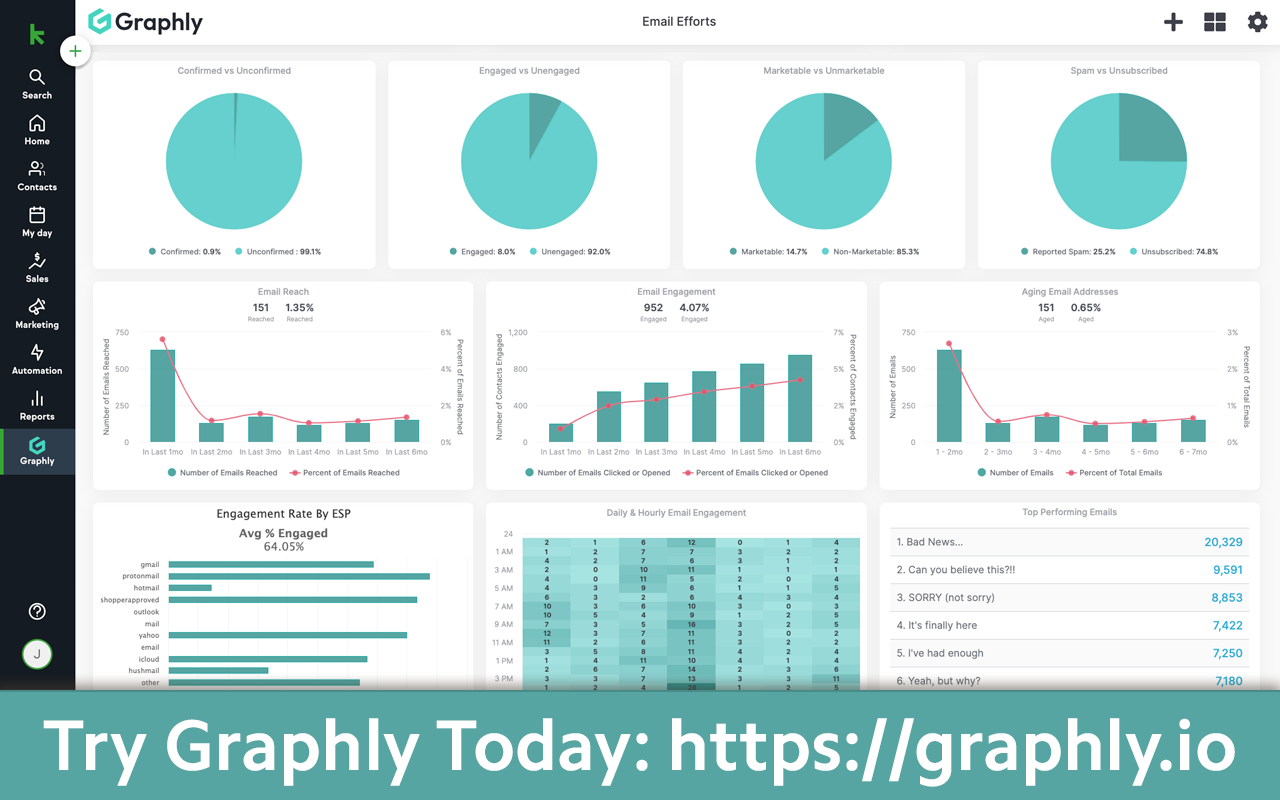
Upgrade simple saved searches to visual charts and graphs that provide additional context and actionable insights. Making savvy business decisions has never been easier. Experience the magic of seeing your Keap data visually with Graphly.
→ View Graphly Inside of Keap ←
You can view your Graphly dashboard inside your Keap account using this browser extension. No need for additional browser tabs or logging in elsewhere.
→ Over 140 Reports and Counting ←
Graphly has a library of 140 report templates conveniently organized into categories. Each report template can be configured with various settings, filters, and date ranges to ultimately produce thousands of unique reports.
→ Drag and Drop Builder ←
No two businesses are the same…why should their dashboards be? Our twelve-column grid gives you the ultimate flexibility to resize individual reports on your dashboard and reposition them in a custom layout that makes sense to you and your organization.
→ Unlimited Users ←
Share dashboards with as many team members, partners, investors, or other interested parties without requiring them to be users inside your Keap account.
→ User Permissions ←
Grant or restrict access to certain features or functionality by assigning 1 of 4 access levels to individual users. This will determine their ability to create, share, and view reports and dashboards and update their Graphly account’s billing information.
→ Public Dashboards ←
Do you want to share dashboards with individuals outside of your organization or even embed a dashboard on your public website or inside your membership site? Auto-generate a public URL that can be shared easily with non-users.
→ Multiple Keap Accounts ←
Own more than one business? Graphly makes it easy to log in with one set of credentials and access all your accounts. Just two clicks move you from one Graphly account to another. Requirement: you’ll need a Graphly account for each Keap account.
→ Data Exports ←
Take the information with you. Click the top left menu on any report to export the report as a .png, .svg, or .csv file.
→ Record Reveal ←
Click on any data point in any report to see a list of records represented in the graph, whether contact records, opportunity records, order records, or others.
→ Batch Actions ←
Trigger batch actions to the contacts associated with your Keap report. Simply select the contacts and then click to add a tag, remove a tag, create a new tag and apply it, start a sequence, or stop a sequence.
→ Build Tools ←
Graphly’s clone tool can help you speed up the process of building similar reports. Simply clone an existing report and make the necessary tweaks in your new report. You can also clone entire dashboards, bringing over the exact reports with their corresponding layout on the dashboard.
→ Cross-Device Compatibility ←
Use Graphly anywhere on any device. Desktops, laptops, tablets, and smartphones...regardless of the device you use to interact with Graphly, you’re guaranteed to have a slick and intuitive experience – whether you’re at home, in the office, or on the go.
→ Filters ←
Working with data often means writing SQL queries, which is great for engineers or data scientists but is nearly impossible for everyone else. Our filters feature allows you to quickly and easily slice and dice the data into narrow segments of your choosing. Include criteria from various record types and select from standard and custom fields.
→ Growing Data Sources ←
Graphly was designed specifically for Keap users, so we have begun integrating it with other apps in the Keap ecosystem, including FixYourFunnel, FuseDesk, Parsey, and more in the future.
→ Theming ←
Tailor your viewing experience to your personal preference or environment by selecting either a light or dark background and then choosing one of multiple color palettes.
Keap reporting never looked this good. Visit https://graphly.io to create your account now.